A Timing Discussion of the AMSAT IHU-style CAN Message Traffic
(or AMSAT CAN Bus Command/Status Timing Derivation)
-by Stephen, KZ0Q
I think I can lend some idea of what the traffic looks like and what
the resulting timing is on the CAN Bus.
A fun list of things affect the actual bus bandwidth available
so we have to freeze some of these things in order to calculate what we would
see for a given flying configuration.
Let me describe how I view this and explain my thinking as I go.
Let's start with our "planning" payload count by saying that we, for
this exercise, are flying a 15 module bus (15 Widgets, one on front of
each module communicating with the IHU). Let us also say the mix is 3
Mux-mode Widgets and remaining 12 of our 15 are standard and pipe-mode.
I make this distinction due to the fact that mux-mode widgets have a
different configure packet length (8 bytes vs. 2-bytes) and a different
number of 8-byte response packets (3 packets vs. 2-packets). We must
know this mix so we can predict our traffic on the bus.
Our standard communication with the widget is to configure it (send
it's digital output values and power state) and then wait for it to
digitize the analog channels and reply with the digital input state and
analog state.
This digitizing of the analog channels dominates the overall roundtrip time so really there
is ~7.14 mSec from the start of the configure packet to the start of the response
packets being returned. The response packets are sent back to back on
the bus with no delay in between.
Now let's look at the number bits on the CAN Bus. We say we have two-byte
and eight-byte packets but what we really mean in CAN terms is that we
have a header followed by two or eight bytes of payload. Also we have
extra bits inserted in the stream so the receivers can synchronize to
the bit stream. These presence of these extra "Stuff" bits is totally dependent upon the
sequence of ones and zeros in the stream so cannot really be predicted.
So what does this mean? For a two byte (payload) packet we will see
anywhere from 63 to 73 bits of message on the bus followed by 3 bits of
BUS IDLE time. For an 8-byte message this is 111 to 130 bits of message followed by the 3-bits idle.
For our two-response 8-byte-packet case we now see 222 to 260 bits
plus two idle times (or 6 bits) and for our three-response case this
jumps to 333 to 390 bits with 9 bits idle.
Again so we can calculate, but let's freeze the bit stream at a
"simple average" number of bits: 2-byte payload = 68 bits, 3 byte payload = 121
bits, etc. Likewise, two-response packets = 242 bits and
three-response = 363 bits. All of this is excluding the idle 3-bits
between packets.
So, getting back to our traffic-on-the-bus calculations: we have 15
devices to configure every 20 mSec after which we read their status.
With our calculated bits per packet and fixed device mix we now come up
with 1224 bits of configure traffic (counting idle bits) yielding an
occupied bus time of 1.53 mSec (at our 800Kbps rate) for these configure packets. This is
followed by the remainder of the ~7.14 mSec digitize wait (all 15 widgets are busy
digitizing) and then the stream of responses appears on the bus: 4038
bits (including idle time) of 5.05 mSec. These leaves 7.81 mSec of
available (idle) bus time until the next 20mSec configure start this
all over again. So, determining the bus idle time during the
digitize wait until the responses start arriving we have (7.14-1.53=5.61
mSec). Add to this our bus idle time after the responses of
7.81 mSec and we see that we have 13.42 mSec of bus idle during each 20
mSec period, 67% bus idle. Please remember that these are rough
numbers and that if we look carefully there are delays and a configure
packet length which should also be subtracted but I think for this
exercise you get the idea of how this is all calculated. I'll
leave more precise calculation to you our reader. ;-)
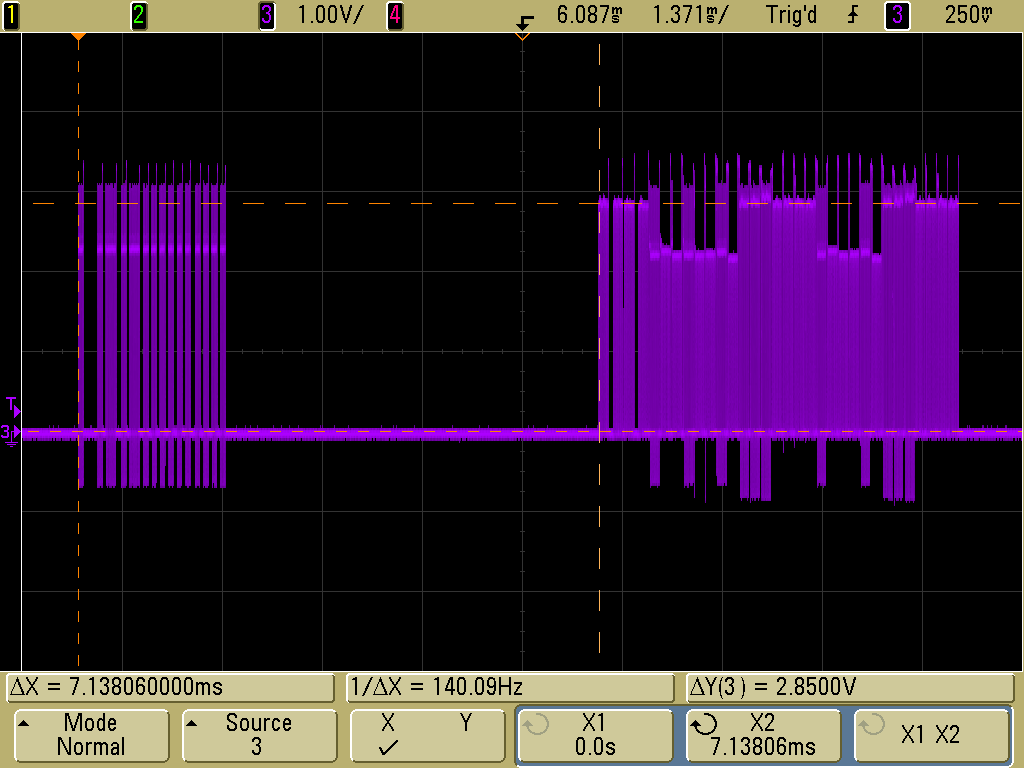
The picture to the right (click to enlarge) shows traffic of
the form I'm presenting. The 15 configures happen all at once at
the start of the 20 mSec interval. Then the digitizing effort
completes and the Widgets start to respond. Markers in the picture
(Delta X) show the duration of the highest priority Widgets' digitizing
effort (7.138 mSec). The responses simply line up after one another
since our CAN protocol at the physical layer provides for
non-destructive collision detection and retransmission. That is to
say that when collisions occur the winning packet is still delivered
intact without requiring retransmission. In the end all the widgets
simply wait their turn to deliver their response packets. During this
collision-detection and hold off we incur no additional traffic due to
these collisions thanks to this being the CAN bus.
I hope this explanation helps you to understand our AMSAT
configure/ response traffic. If you have any questions
regarding this material feel free to write to me at the email
address below.
-Stephen, KZ0Q |